the S&P 500, 1975 to June 2024
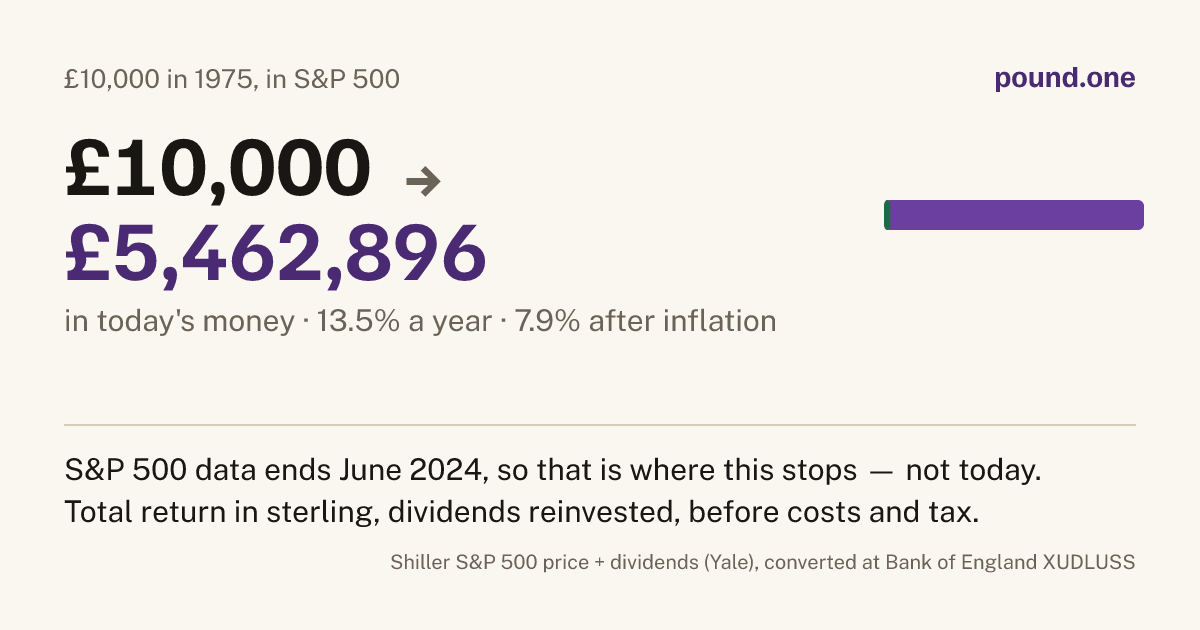
£10,000 in 1975 is £5,462,896 in today's money
That £10,000 was £130,206 in today's money. So you multiplied what you actually had by 42.0×, not 524×.
13.5% a year7.9% a year after inflation£5,238,142 in June 2024 money

The same money elsewhere
Same amount, same years, same contributions. Figures are in today's money, after any charges, before tax.
| Instead | In today's money | Real multiple |
|---|---|---|
| A UK houseUK house, to December 2025 | £259,729 | 2.0× |
| Cash at Bank Ratecash | £231,269 | 1.8× |
| A 60/40 portfolio60/40, to June 2024 | £1,526,284 | 11.7× |
| An 80/20 portfolio80/20, to June 2024 | £2,789,555 | 21.4× |
| Just keeping up with pricesinflation, to December 2025 | £130,206 | 1.0× |
| The S&P 500 | £5,462,896 | 42.0× |
What this leaves out
Tax, dealing costs and the spread. Anyone actually saving would have changed their mind at least once. Past returns are a record of what happened, not a forecast — the future is genuinely unknown, and none of this is advice.