RPI inflation, 1976 to July 2026
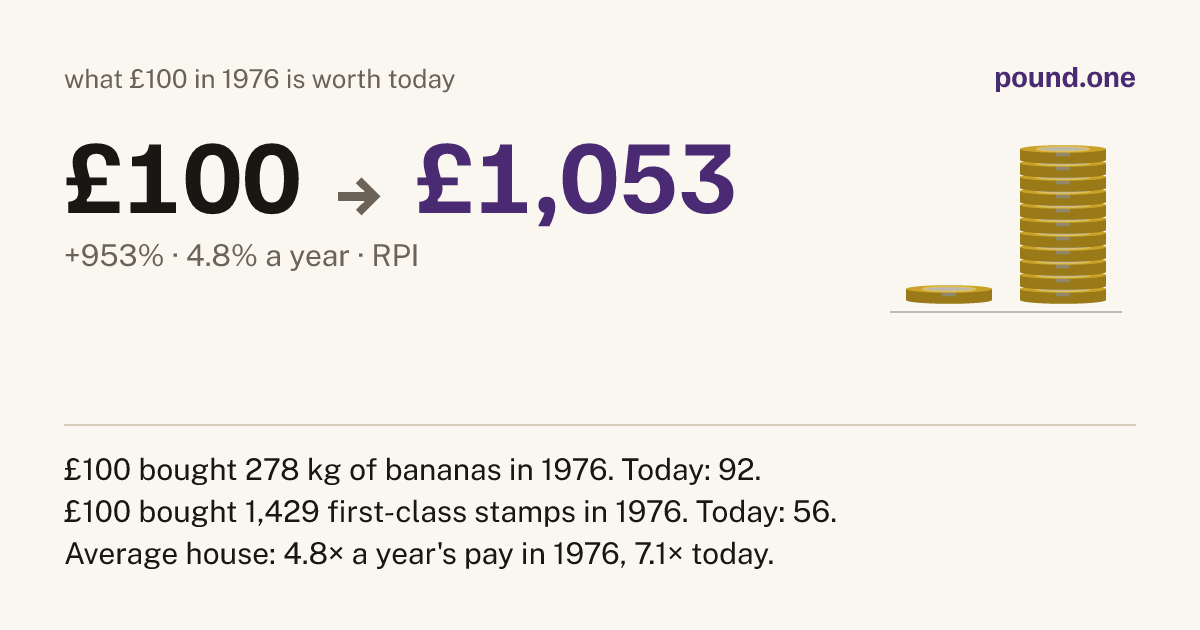
£100 in 1976 is £1,053 today
That £100 bought 278 kg of bananas in 1976. Today it buys 92.
Prices up 953%4.8% a year on averageMultiply by 10.53

What £100 buys
Official average shop prices, not a basket. Things marked as outrunning inflation got dearer faster than everything else; things that lagged got relatively cheaper.
| Item | 1976 | Today |
|---|---|---|
| kg of bananaslagged inflation36p then, about £1.09 today | 278 | 92 |
| first-class stampsoutran inflation7p then, £1.80 today | 1,429 | 56 |
| kg of roasting chickenlagged inflation88p then, about £4.04 today | 114 | 25 |
| dozen eggslagged inflation43p then, about £2.38 today | 233 | 42 |
| kg of rump steaklagged inflation£3.05 then, about £20.21 today | 33 | 4.9 |
| pints of milklagged inflation9p then, about 70p today | 1,064 | 144 |
| sliced white loaveslagged inflation18p then, about £1.50 today | 556 | 67 |
| Same money, adjusted for inflation | £100 | £1,053 |
The ONS stopped publishing these average prices in January 2025. Today's figures are that last reading moved on with inflation, so treat them as close rather than exact.
Houses and wages
Inflation is one story. What people earned, and what a home cost, are the other two.
Average house
£11,866 → £278,784
Up 23.5×, against 10.5× for prices generally
Average pay
£2,470 → £39,260
A year's average earnings, up 15.9×
Years of pay for a house
4.8 → 7.1
Average house price divided by average annual pay
If it had tracked wages
£1,589
What £100 in 1976 would be today if it had grown with pay rather than prices